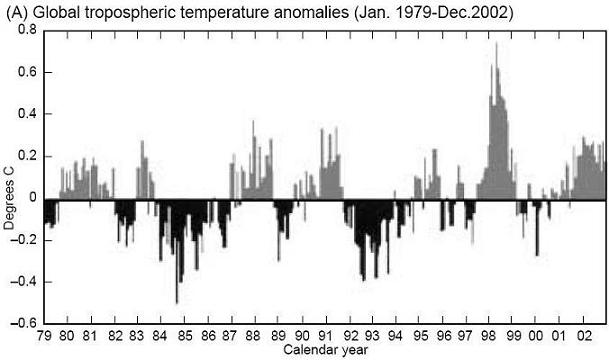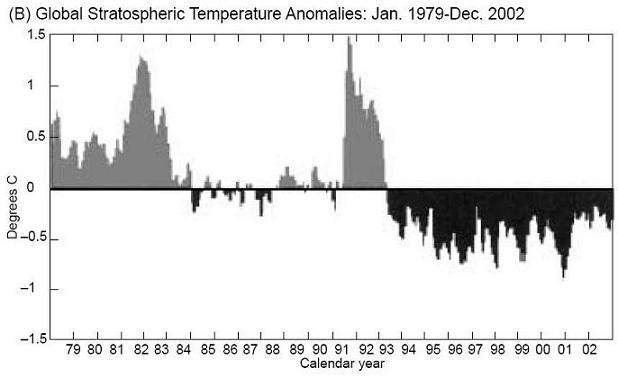

Since 1979, the equipment deployed by NASA on 9 TITOS-N satellites has performed 270,000 measurements daily of the temperature in the lower troposphere (from the Earth's surface up to 8 km) and in the lower stratosphere (14 to 22 km). The measurements are taken every 12 hours, virtually all over the globe, with no disturbance from local effects, such as urban "heat islands."


(A) shows average monthly temperatures of the lower troposphere, which have alternately warmed and cooled in the last 24 years. The more sizable temperature rise in 1998 was caused by the El Nino effect. In the entire period, there is a weak cooling of approximately -0.06°C per decade.
(B) shows the deviations in temperature from the seasonally adjusted average in the lower stratosphere. The 1982 temperature rise was caused by the pollution of the stratosphere with sulphuric acid aerosols from the eruption of volcano El Chichon; similarly, the rise in 1991 was caused by the eruption of Mt. Pinatubo in the Philippines. The coldest month recorded in the stratosphere occurred in September 1996.
These measurements are in conflict both with the results of ground measurements, which indicate a sharp rise in temperature, and with the computerized models, which predicted that the lower troposphere would be heated more than the Earth's surface.
Source: Adapted from R. Spencer and J. Christy, 2003. "What Microwaves Teach Us About the Atmosphere," http://www.ghcc.msfc.nasa.gov/overview/microwave.html, 2003.